← Explore all worldsTides
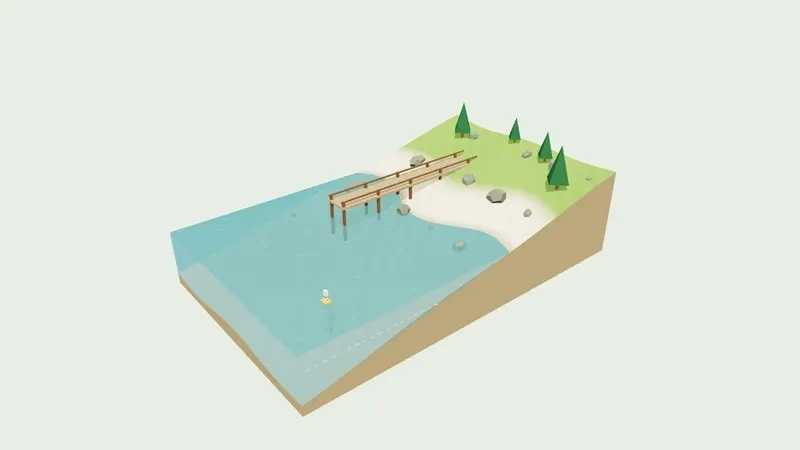
Watch the sea rise and fall along a sandy coast. Explore how the Moon and Sun combine to create spring and neap tides.
Enable JavaScript in a browser with WebGL 2 to run this interactive simulation.
The Moon and Sun pull on the ocean. As Earth turns, the sea rises and falls along the coast.
- At new and full Moon, the gap between high and low water is bigger. These are spring tides. At quarter Moons, the gap is smaller. These are neap tides.
- The blue outline shows two bulges in the ocean, made bigger so you can see them. The gold dot marks our coast as Earth turns.
- The gauge shows the water level. The chart shows how it will change over the next 48 hours in this model.
Try this: Compare New and First quarter. Then choose 5× to watch the water cover and uncover the beach.